Mfr Part # DIS01447T
PI TERMINAL-7 1024*600 IPS HMI C
Elecrow
License: General Public License Raspberry Pi SBC
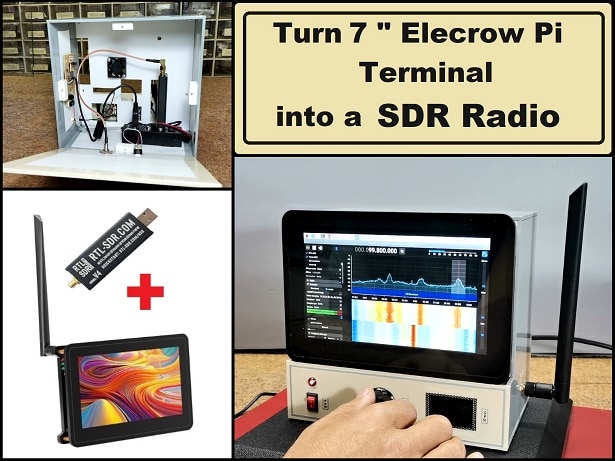
Recently, in one of my previous videos, I introduced you to the 7-inch Elecrow Pi Terminal and how to make an SDR radio with it. This time I will present you with a very simple way to make a beautiful weather dashboard with current weather, 5-day weather forecast, and 5-day meteogram graph. The original project and idea are from the given GitHub page (https://github.com/infinitel8p/weather-forecast?tab=readme-ov-file), and all the credit goes to the author of this project.
I have previously developed many projects in this area, so based on that experience, I decided to modify this project in the best possible way. The program is developed in Astro, which is a JavaScript web framework optimized for building websites. I tested the device on the latest Raspberry Pi OS, Debian 64-bit, but it works great on older 32-bit versions of the OS.
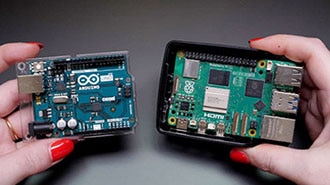
I performed the development and testing on a Raspberry Pi 5 board and a standard PC monitor, and then I just transferred the SD card to the Elecrow Pi Terminal, which uses Raspberry Pi CM4 without any modifications, except for setting the appropriate resolution according to the display.
Below, I will explain in detail how to install and configure the weather dashboard:
First, we open a Terminal window and clone the project from GitHub with the command:
git clone https://github.com/infinitel8p/weather-forecast.git
This creates a folder named weather-forecast in: /home/pi
We need to replace certain files with the given ones to make the changes. The files that need to be replaced are:
WeatherChart.jsx
index.astro
and global.css
- Index.astro is placed in /home/pi/weather-forecast/src/pages
- WeatherChart.jsx is placed in home/pi/weather-forecast/src/components
- global.css is replaced in /home/pi/weather-forecast/src/styles
Next, in the .env file, we enter the free API key that we previously created on the OpenWeatherMap page. Now, in notes.txt you need to enter data for the place, latitude, longitude, country, and state.
Next is the installation of support: In the Terminal, run the command
npm install
Then go to https://nodejs.org/en/download
Here, we select the Linux OS and run the given script in the terminal.
When the installation of the support is complete, we can start the program.
In the Weather-forecast folder in the terminal, we write:
npm run dev
Now, by right-clicking on LOCAL (address), we select open in URL. This opens the program within the browser, and to switch to full screen, we need to press F11.
Next, we insert the prepared micro-SD card into the Elecrow Pi Terminal device and start it. When starting the program and entering data, I use a standard keyboard and mouse, but it is desirable to use a mini Bluetooth keyboard-mouse combination for compactness. In the coming period, I will also create a simple script to start the program automatically when the operating system starts. In fact, this weather dashboard is a web-based interface, so the size is automatically adjusted according to the screen resolution. So without modifications, it can be started in fullscreen on displays with different resolutions.
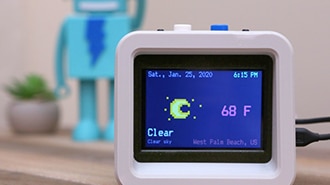
Now let's see how the device works in real conditions. Immediately after starting the program, data is downloaded from the OpenWeatherMap page and displayed on the display. Changes compared to the original are:
- English language instead of German
- Using the Free API key from OpenWeatherMaps instead of the One Call API key, which gives more information but is paid
- The most important change is the graph for the next 5 days, unlike the previous one, which covered a 24-hour period.
- And small changes in the colors and overall appearance
The upper left part shows the basic data about the current weather conditions. Here you can find information about the place to which the forecast applies, a graphic display of the weather conditions through a large icon, and the current temperature, as well as the predicted minimum and maximum temperatures for the current day. The upper right part shows more detailed information, such as wind speed, air humidity, atmospheric pressure, UV index, visibility, and percentage of cloud cover, as well as sunrise and sunset times. At the bottom, we have icons that visually display the predicted weather conditions for the next 5 days, as well as the maximum temperatures for this period. And in the middle of the screen is the most important part, in meteorology known as the Meteogram, which graphically represents the predicted weather conditions for the next period. I didn't want to overload the graph with too much information, and for the sake of clarity, I set three basic parameters according to my needs: Temperature, air pressure, and precipitation amount. Otherwise, you can very easily draw a graph for all the parameters that you see in the upper right part of the screen. The temperature and pressure graphs are drawn dynamically based on the highest and lowest values over the next 5 days, so they are always clearly visible. The same applies to precipitation, which I have presented with vertical bars for the same reason.
I should also mention that the program has two color schemes: daytime and night (dark blue background), which change automatically depending on whether it is day or night.
And finally, a short conclusion. This is a full-screen weather dashboard featuring a 5-day forecast and dynamic meteogram using the Elecrow Pi Terminal and Raspberry Pi. My goal was to create a display where a single glance tells you everything you need to know for the week ahead—from temperature trends to air pressure and precipitation.